
激光熒光植物應用譜圖研究
Fluorescence Scheimpflug LiDAR developed for the three-dimension profiling of plants
HONGZE LIN,1 YAO ZHANG,1 AND LIANG MEI2,*
1School of Automation, Hangzhou Dianzi University, Hangzhou 310018, China 2School of Optoelectronic Engineering and Instrumentation Science, Dalian University of Technology,
Dalian 116024, China
*meiliang@dlut.edu.cn
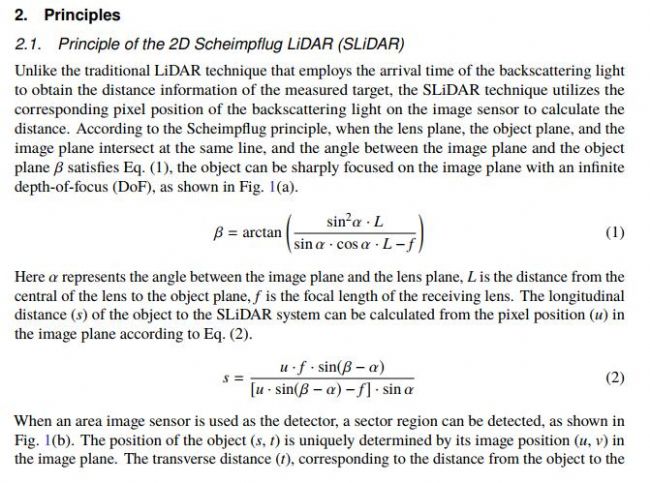
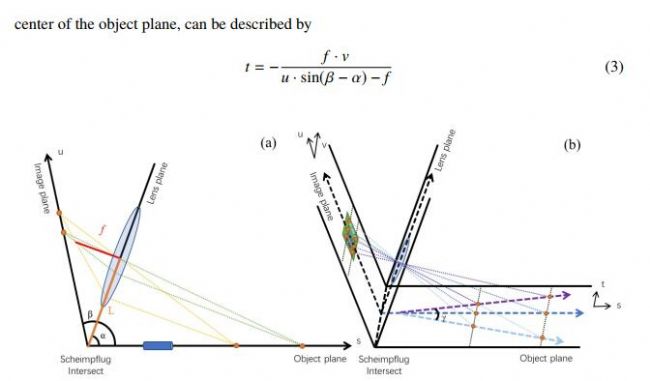 Fig. 1. (a) Principle of the 1D SLiDAR: the object plane, the lens plane and the image plane
intersect at the same line. L is the distance to the intersect line from the center of the lens, α
is the angle between the lens and the object plane, β is the angle between the image plane
and the object plane, f is the focal length of the lens. (b) Principle of the 2D SLiDAR. Each
column (u-axis) of the area image sensor in the image plane corresponds to a single line in
the object plane, as indicated by lines with arrows. All the lines intersect at one point, which
is the projection of the principal point of the lens on the object plane.
of a 3D profile measurement; inset: coordinate conversion of each sectional image, Φ is the
elevation angle, R is the distance from rotation axis to the plane of light sheet, the t-axis and
y-axis are parallel, the 3D coordination position of each sectional image can be calculated by
trigonometric.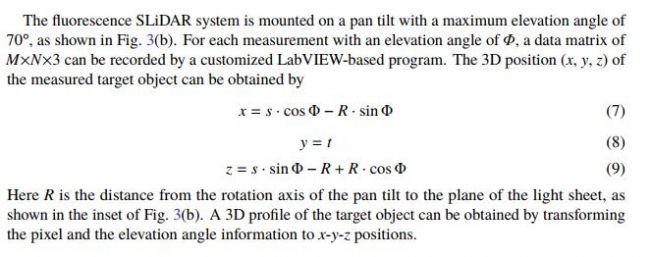
HONGZE LIN,1 YAO ZHANG,1 AND LIANG MEI2,*
1School of Automation, Hangzhou Dianzi University, Hangzhou 310018, China 2School of Optoelectronic Engineering and Instrumentation Science, Dalian University of Technology,
Dalian 116024, China
*meiliang@dlut.edu.cn
Abstract: This work proposes a novel fluorescence Scheimpflug LiDAR (SLiDAR) technique based on the Scheimpflug principle for three-dimension (3D) plant profile measurements. A 405 nm laser diode was employed as the excitation light source to generate a light sheet. Both the elastic and inelastic/fluorescence signals from a target object (e.g., plants) can be simultaneously measured by the fluorescence SLiDAR system employing a color image sensor with blue, green and red detection channels. The 3D profile can be obtained from the elastic signal recorded by blue pixels through elevation scanning measurements, while the fluorescence intensity of the target object is mainly acquired by red and green pixels. The normalized fluorescence intensity of the red channel, related to the chlorophyll distribution of the plant, can be utilized for the classification of leaves, branches and trunks. The promising results demonstrated in this work have shown a great potential of employing the fluorescence SLiDAR technique for 3D fluorescence profiling of plants in agriculture and forestry applications.
© 2020 Optical Society of America under the terms of the OSA Open Access Publishing Agreement
© 2020 Optical Society of America under the terms of the OSA Open Access Publishing Agreement
1. Introduction
The Paris Agreement set a target of “holding the increase in the global average temperature to well below 2 °C above pre-industrial levels and to pursue efforts to limit the temperature increase to 1.5 °C above pre-industrial levels.” In order to achieve this goal, methods such as afforestation/reforestation, avoided deforestation, and biomass energy with carbon capture and storage (BECCS) are widely employed. It has been determined that forest-based mitigation could be more efficient for atmospheric CO2 removal than BECCS [1]. Forest, which contains up to 80% of all aboveground carbon [2], is one of the keys to achieve the target set by the Paris Agreement. Accurate estimation of forest biomass provides an important basis for assessing/tracking the current state of forest carbon pools and their rates of changing [3]. It is also helpful for predicting how much industrial carbon emissions can be offset by forest carbon sequestration in the future. The traditional approach for estimating carbon stocks is to calculate the aboveground biomass, according to allometric equations using the mean diameter at breast height (DBH) of the trunk or the bole of standing trees, and then multiply it with the number of trees in a forest [4]. Though it is convenient to calculate the biomass through this method, its accuracy is limited.
In recent years, light detection and ranging (LiDAR) has become one of the major tools in forest three-dimension (3D) structure measurement [5–9]. The conventional LiDAR used is mainly based on the time-of-flight (ToF) principle, which means up to four-dimensional data can be collected, including the 3D coordination and the intensity of the collected scattering light [10]. There are mainly two methods, namely the intensity and the geometry relationship, for separating tree branches from leaves. Traditionally, the distance normalized apparent reflectance intensity is utilized for separation of foliage and woody parts [11]. A full-waveform LiDAR instrument cannot only measure the range and the peak intensity, but also the shape of the reflected waveform, which could be utilized for trunk and foliage classifications [5,12]. However, the waveform reflected from trees may vary with tree species, distance, surface characteristics, incident angles, #389043 https://doi.org/10.1364/OE.389043 Journal © 2020 Received 6 Feb 2020; revised 29 Feb 2020; accepted 10 Mar 2020; published 17 Mar 2020
Vol. 28, No. 7 / 30 March 2020 / Optics Express 9270 etc. [13]. Full waveform multispectral LiDAR is able to provide multispectral 3D data clouds by using a supercontinuum laser [14,15]. Yotam et al., proposed an automatic algorithm employing a series of global optimizations to consolidate a point cloud into skeletal structures. However, the existence of dense crowns could be a great challenge for the 3D reconstruction [16]. Three-dimension coordinate points-based methods are promising for wood-leaf separation, but requiring a high-quality point cloud [17]. Fluorescence LiDAR techniques, mainly based on the Newtonian telescope structure, have been used in atmospheric aerosol measurements.When using fluorescence LiDAR for plant detection in short distance, data acquisition card with sampling rate higher than 1 GHz has to be used for resolving the fine profile [18]. If the position information as well as the laser-induced fluorescence (LIF) signal, or even multi-channel fluorescence signals can be measured by the LiDAR technique, more accurate and direct methods can be developed for leaves/branches separation and tree reconstruction.
Since 2015, the Scheimpflug LiDAR (SLiDAR) technique, which employs image sensors as detectors [19], has been developed for atmospheric aerosol sensing [20,21], insect monitoring [22], and under water detection [23–25]. By employing inexpensive image sensors as detectors and low-cost multimode laser diodes as light sources, the SLiDAR technique features of low cost and low maintenance. In this paper, a terrestrial 2D fluorescence SLiDAR, employing a multimode high power laser diode as the light source and a color complementary metal–oxide–semiconductor (CMOS) image sensor as the detector, has been developed to obtain the 3D structure as well as the fluorescence distribution of plants. Both the elastic and inelastic/fluorescence signals from plants can be measured by the CMOS sensor with blue, green and red detection channels. The 3D profile can be obtained from the elastic signal recorded by blue pixels through scanning measurements, while the fluorescence intensity of the target object is mainly acquired by red and green pixels. A fluorescence-based method has been proposed and implemented to evaluate the elastic/fluorescence point clouds for classification of tree leaves, branches and even fruits.
intersect at the same line. L is the distance to the intersect line from the center of the lens, α
is the angle between the lens and the object plane, β is the angle between the image plane
and the object plane, f is the focal length of the lens. (b) Principle of the 2D SLiDAR. Each
column (u-axis) of the area image sensor in the image plane corresponds to a single line in
the object plane, as indicated by lines with arrows. All the lines intersect at one point, which
is the projection of the principal point of the lens on the object plane.
ultra-violet and blue light, and emits fluorescence with two peaks centered at 685 nm and 740
nm, respectively [32].
Modern color image sensors often place an RGB filter in front of the photodiodes, allowing
spectral detection of the incoming light. By utilizing color image sensors as detectors, a 2D
fluorescence SLiDAR system can be accomplished and utilized for detecting range-resolved
elastic and inelastic (fluorescence) light from objects. The elastic light is mainly detected by
the blue pixel with a blue filter placed in front. The fluorescence signals, on the other hand,
are mainly acquired by the red and green channels. As the intensity of the elastic light is often
much higher than that of the inelastic or fluorescence light, the received elastic light should be
suppressed by e.g., placing a long-pass filter in front of the image sensor.
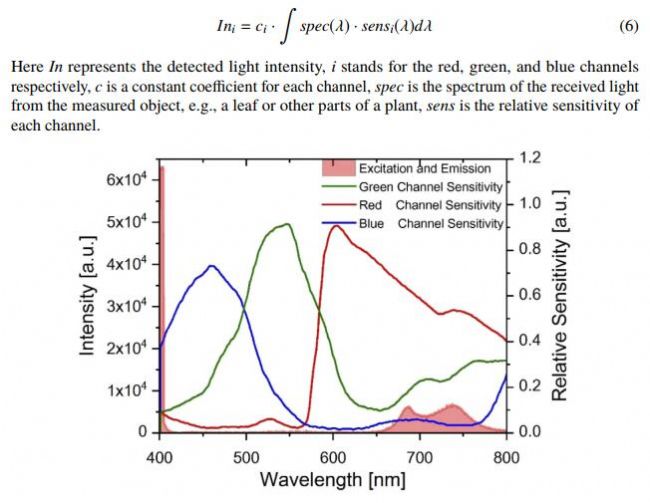
Figure 2 shows the spectrum of the exciting laser and the fluorescence signal from a green leaf,
indicated with red shadow. Strong fluorescence signal peaks can be observed around 685 nm and 740 nm, respectively. According to the detection sensitivities of the red, green, and blue channels shown in Fig. 2, the blue channel mainly responds to the excitation light at 405 nm, while the red channel has a large responsivity for chlorophyll fluorescence. On the other hand, the sensitivities of the green channel are much lower at the blue and the red/near-infrared regions. The detected light intensity of each channel is theoretically described by
nm, respectively [32].
Modern color image sensors often place an RGB filter in front of the photodiodes, allowing
spectral detection of the incoming light. By utilizing color image sensors as detectors, a 2D
fluorescence SLiDAR system can be accomplished and utilized for detecting range-resolved
elastic and inelastic (fluorescence) light from objects. The elastic light is mainly detected by
the blue pixel with a blue filter placed in front. The fluorescence signals, on the other hand,
are mainly acquired by the red and green channels. As the intensity of the elastic light is often
much higher than that of the inelastic or fluorescence light, the received elastic light should be
suppressed by e.g., placing a long-pass filter in front of the image sensor.
Figure 2 shows the spectrum of the exciting laser and the fluorescence signal from a green leaf,
indicated with red shadow. Strong fluorescence signal peaks can be observed around 685 nm and 740 nm, respectively. According to the detection sensitivities of the red, green, and blue channels shown in Fig. 2, the blue channel mainly responds to the excitation light at 405 nm, while the red channel has a large responsivity for chlorophyll fluorescence. On the other hand, the sensitivities of the green channel are much lower at the blue and the red/near-infrared regions. The detected light intensity of each channel is theoretically described by
Fig. 2. Spectra of the excitation and the fluorescence light, together with the relative
sensitivities of RGB channels. The red shadow indicates the spectrum of the excitation light
at 405 nm and the fluorescence of a green leaf.
sensitivities of RGB channels. The red shadow indicates the spectrum of the excitation light
at 405 nm and the fluorescence of a green leaf.
According to above discussions, each pixel in the image plane, located at (u, v), corresponds
to a single point in the object plane, i.e., (s, t). The excitation and the fluorescence spectra for
the object located at (s, t) are evaluated from the RGB values of the corresponding pixel, which
can be used for the classification of leaves or branches. In summary, a data matrix of M×N×3,
representing the elastic and fluorescence light intensities for M×N pixels, is obtained for each
measurement. A three-dimension reconstruction of the target object can thus be achieved by
performing scanning measurements with different elevation angles through a pan tilt.
3. Apparatus and data processing method
3.1. Apparatus The schematic of the fluorescence SLiDAR is shown in Fig. 3(a). The fluorescence SLiDAR consists of a commercial blue laser diode with a central wavelength of 405 nm and a maximum output power of 1 W. A cylindrical lens is mounted to generate a light sheet with a spreading angle of 50° on the s-t plane. The sector angle can be adjusted by replacing the cylindrical lens with different focal lengths. The backscattering light from the illuminated surface is collected by an imaging lens (Canon, Japan) with a focal length of 18 mm and an aperture of 58 mm. The distance from the central of the lens to the light-sheet plane is set to 100 mm. The angle between the CMOS camera and the lens is 10.2°, calculated according to Eq. (1). The CMOS camera (Panasonic, Japan, 4656×3520 pixels, 3.8 µm) is capable of measuring the incoming light with RGB channels. The light intensity of the laser diode is modulated with a square wave to enable measurements under illumination. In one measurement period, the CMOS shoots two photos with laser diode on and off, respectively. The background light, recorded with the laser diode off, can then be subtracted dynamically.
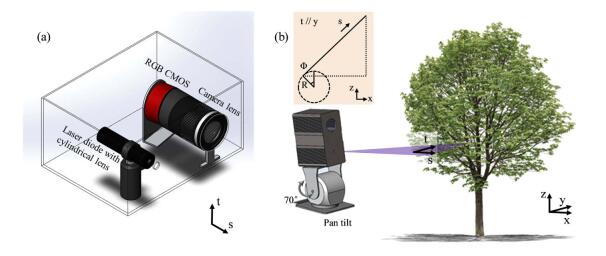
Fig. 3. (a) The schematic diagram of the fluorescence SLiDAR; (b) The schematic diagramto a single point in the object plane, i.e., (s, t). The excitation and the fluorescence spectra for
the object located at (s, t) are evaluated from the RGB values of the corresponding pixel, which
can be used for the classification of leaves or branches. In summary, a data matrix of M×N×3,
representing the elastic and fluorescence light intensities for M×N pixels, is obtained for each
measurement. A three-dimension reconstruction of the target object can thus be achieved by
performing scanning measurements with different elevation angles through a pan tilt.
3. Apparatus and data processing method
3.1. Apparatus The schematic of the fluorescence SLiDAR is shown in Fig. 3(a). The fluorescence SLiDAR consists of a commercial blue laser diode with a central wavelength of 405 nm and a maximum output power of 1 W. A cylindrical lens is mounted to generate a light sheet with a spreading angle of 50° on the s-t plane. The sector angle can be adjusted by replacing the cylindrical lens with different focal lengths. The backscattering light from the illuminated surface is collected by an imaging lens (Canon, Japan) with a focal length of 18 mm and an aperture of 58 mm. The distance from the central of the lens to the light-sheet plane is set to 100 mm. The angle between the CMOS camera and the lens is 10.2°, calculated according to Eq. (1). The CMOS camera (Panasonic, Japan, 4656×3520 pixels, 3.8 µm) is capable of measuring the incoming light with RGB channels. The light intensity of the laser diode is modulated with a square wave to enable measurements under illumination. In one measurement period, the CMOS shoots two photos with laser diode on and off, respectively. The background light, recorded with the laser diode off, can then be subtracted dynamically.
of a 3D profile measurement; inset: coordinate conversion of each sectional image, Φ is the
elevation angle, R is the distance from rotation axis to the plane of light sheet, the t-axis and
y-axis are parallel, the 3D coordination position of each sectional image can be calculated by
trigonometric.


Copyright(C) 1998-2025 生物器材網 電話:021-64166852;13621656896 E-mail:info@bio-equip.com